Performance
Ensures rapid data handling, enabling seamless interaction with large datasets for optimal efficiency in a fast paced environment.
Interaction
Facilitates enhanced user engagement with intuitive sorting, filtering, and data manipulation features for a superior user experience.
Customise
Extensive customisation options, allowing users to tailor grid functionalities and aesthetics to full-fill precise requirements.
Saves Time
Accelerates data understanding, analysis and decision-making for users with quick access to pertinent information.
Selecting the Data Source - Incidents & critical events, compliance activities, notifications, tasks, people, response forms.
Setting Up Filtering - specify a specific filter from the data source or apply additional filters if required.
Configuring Key Features - Options include column ordering, selection, filtering, pin columns, map view, export and action links.
Choosing Columns of Data - select which columns from the data source should be displayed in the grid.
Preview and Implementation - preview the grid with some actual data and save
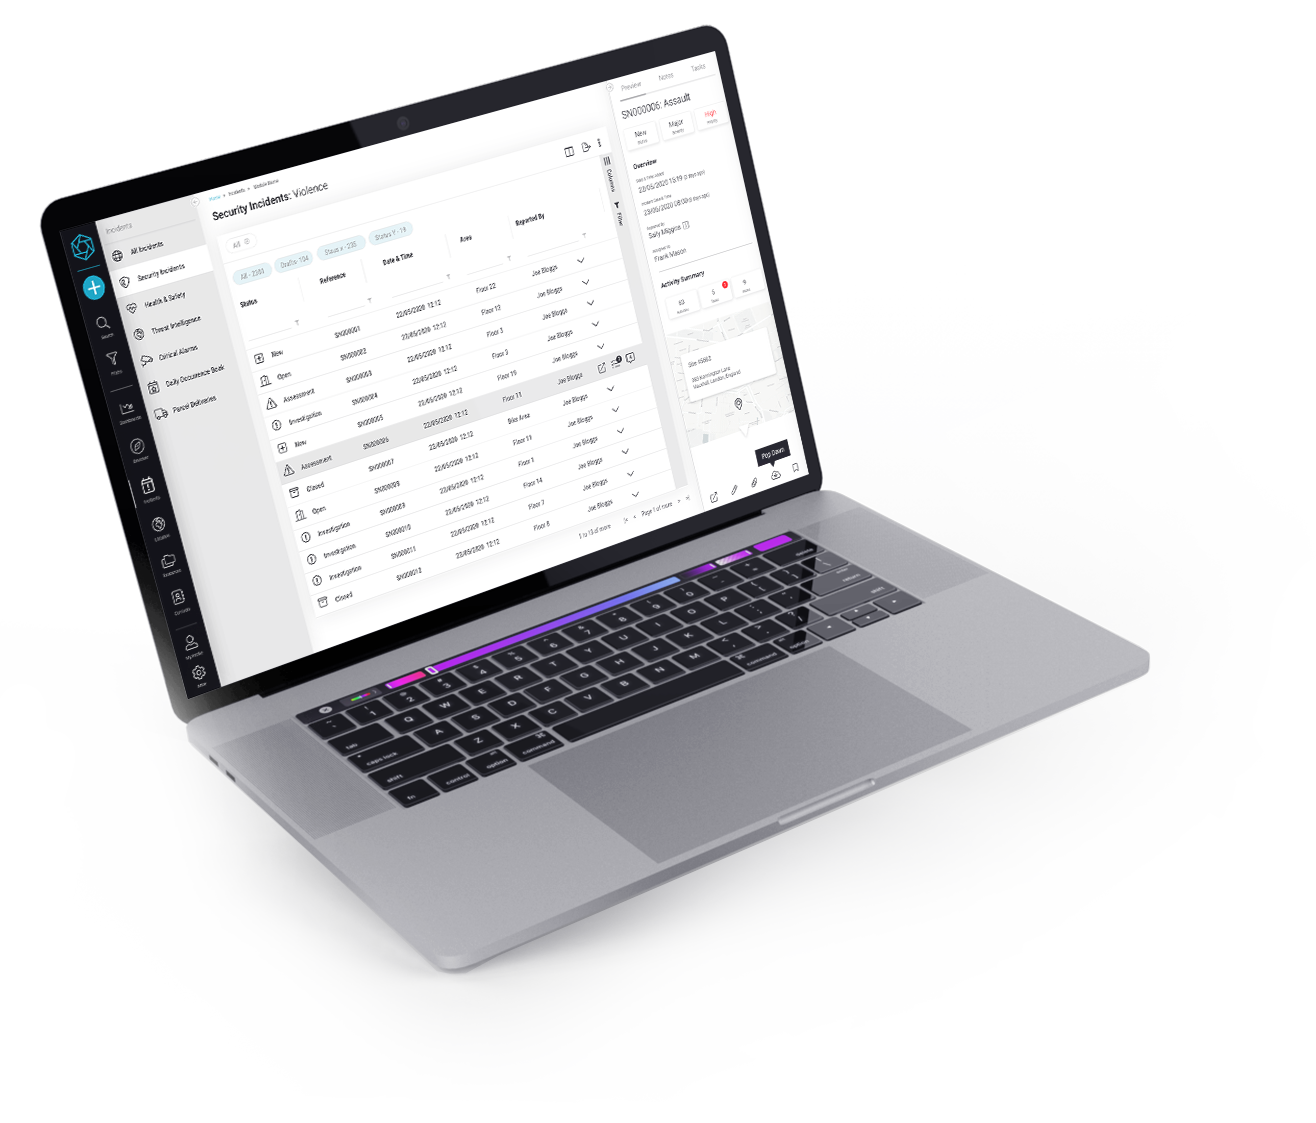
List view - versatile, interactive and powerful listing tool for handling complex data efficiently.
Map view - flip from list to map to visualise the data on a map with volume-based clusters/PINs
Calendar view - interactive calendar to view data (Command & Verify - display scheduled patrols, Reporter - all events)
Row Data - Core dataset entries displayed within the grid rows.
Row Sorting - Organise rows in ascending or descending order quickly.
Row Spanning - Extend cells vertically across multiple rows for clarity.
Row Pagination - Divide rows into manageable pages for easier navigation.
Row Inline Editing - Modify the 'Status' field directly within the grid interface for rapid updating.
Row Cell Styling - Customise cell appearance based on data or state.
Row Selection Preview Panel - Display selected row details in a dedicated slide-out panel showing high level details.
Row Filtering - Refine data display by applying various criteria filters - all fields in the grid - text, number, selection, date
Row Multi-filters - Apply multiple filters simultaneously for refined data analysis.
Row Parent-filters - Parent filtering of linked modules - category, type, severity, status, priority, site, region
Row Actions - Perform specific (configurable( operations directly on selected grid rows - view, edit, add note.
Row Export - Extract the entire or filtered down grid data to CSV file format easily.
Column Headers - Define and customise labels for grid data columns.
Column Sizing - Adjust column widths manually or automatically for fit.
Column Moving - Rearrange columns through drag-and-drop for easy customisation.
Column Pinning - Secure columns in place while scrolling through data.
Column Filtering - Refine data visibility by applying column-specific filters - text, number, selection, date selector.
Columns Tool Panel - Interactive sidebar for managing and configuring grid columns - adding, turning on/off, ordering
Grouping - Cluster rows by values for organised data display (available on the 'Data' module only).
Filtering Groups - Apply filters to grouped data for targeted insights.
Tree Data - Visualise hierarchical data in an expandable tree format.
Pivot - Organise data into groups, summarise with pivot tables.
Aggregation - Summarise data values using mathematical or statistical operations.
Data Filter - Filtering of incidents, critical events & compliance activities by category, type, severity, status, priority, site, region.
Events - Sort by newest, oldest, severity high to low, priority high to low, bookmarked).
Tasks - Sort by due date, newest, oldest, assigned to me, reported by me).
Notifications - Sort by newest, oldest, unread, bookmarked).
A customisable data grid 'wizard' builder is a powerful tool designed to help users create and configure data grids dynamically. It guides users through a step-by-step process to select and customise various aspects of their grid, including the data source, key features, columns of data, and filtering tools. The wizard streamlines the process of setting up a complex data grid but also empowers users with little to no technical expertise to create highly functional and customised data presentations. This approach enhances user experience and productivity, allowing for rapid deployment and iterative development.
Here’s how such a builder typically works:
Data grid offers numerous advantages over a traditional lists, especially in scenarios involving complex datasets and the need for dynamic user interaction.
Provides extensive interactive features such as sorting, filtering, and pagination, which are not typically available in static lists. This allows users to engage with and manage the data more effectively, tailoring the view to their needs.
Optimised for performance with large datasets, efficiently managing thousands to millions of rows without degrading the user experience. Traditional lists can struggle with performance issues as data volume grows.
Customise almost every aspect of the grid's behaviour and appearance, from cell rendering to complex data structures like tree data and grouped rows. This level of customisation is generally not available in simpler list implementations.
Supports rapid data updates, which is crucial for applications that require the display of continuously changing data.
Features like row grouping, pivoting, and aggregation are built-in with Ag-Grid. These allow for sophisticated data analysis and visualisation directly within the grid, which static lists cannot provide.
Designed with accessibility in mind, supporting roles and keyboard navigation.
Switching between list and map views allows users to choose the most effective way to view and interact with data based on their specific needs at any moment, thereby enhancing the functionality and accessibility of an application.
Users can export data from the grid to CSV, facilitating further analysis or reporting outside the application.
Flipping from a list view to a map view in an application can offer several benefits, enhancing user experience and providing more context to the displayed data. Switching between list and map views allows users to choose the most effective way to view and interact with data based on their specific needs at any moment, thereby enhancing the functionality and accessibility of an application. Here are some of the key advantages:
A map view provides geographical context that a list simply cannot offer. Seeing data plotted on a map allows users to understand spatial relationships and distributions, which is especially useful for location-based data.
Map view is a visually engaging and can make the application more interactive and appealing to users. This can lead to a more enjoyable user experience and potentially increased user engagement.
In a map view, patterns such as clustering or geographic trends can be immediately apparent, which might not be noticeable in a list format. This can be crucial for decision-making and analysis in many fields like real estate, logistics, and environmental studies.
Map view often allow users to interact with the data more dynamically. Users can zoom in and out, pan across different regions, and click on markers for detailed information, which can make exploring the data more intuitive than scrolling through a long list.
In map views, data filtering can be visually represented, such as highlighting areas that meet certain criteria or dimming others that don't. This visual differentiation can help users quickly identify areas of interest or concern.
Map view can support multiple layers that users can toggle on and off to view different types of data simultaneously or isolate specific datasets. This flexibility is useful to see locations of sites, people and other events.