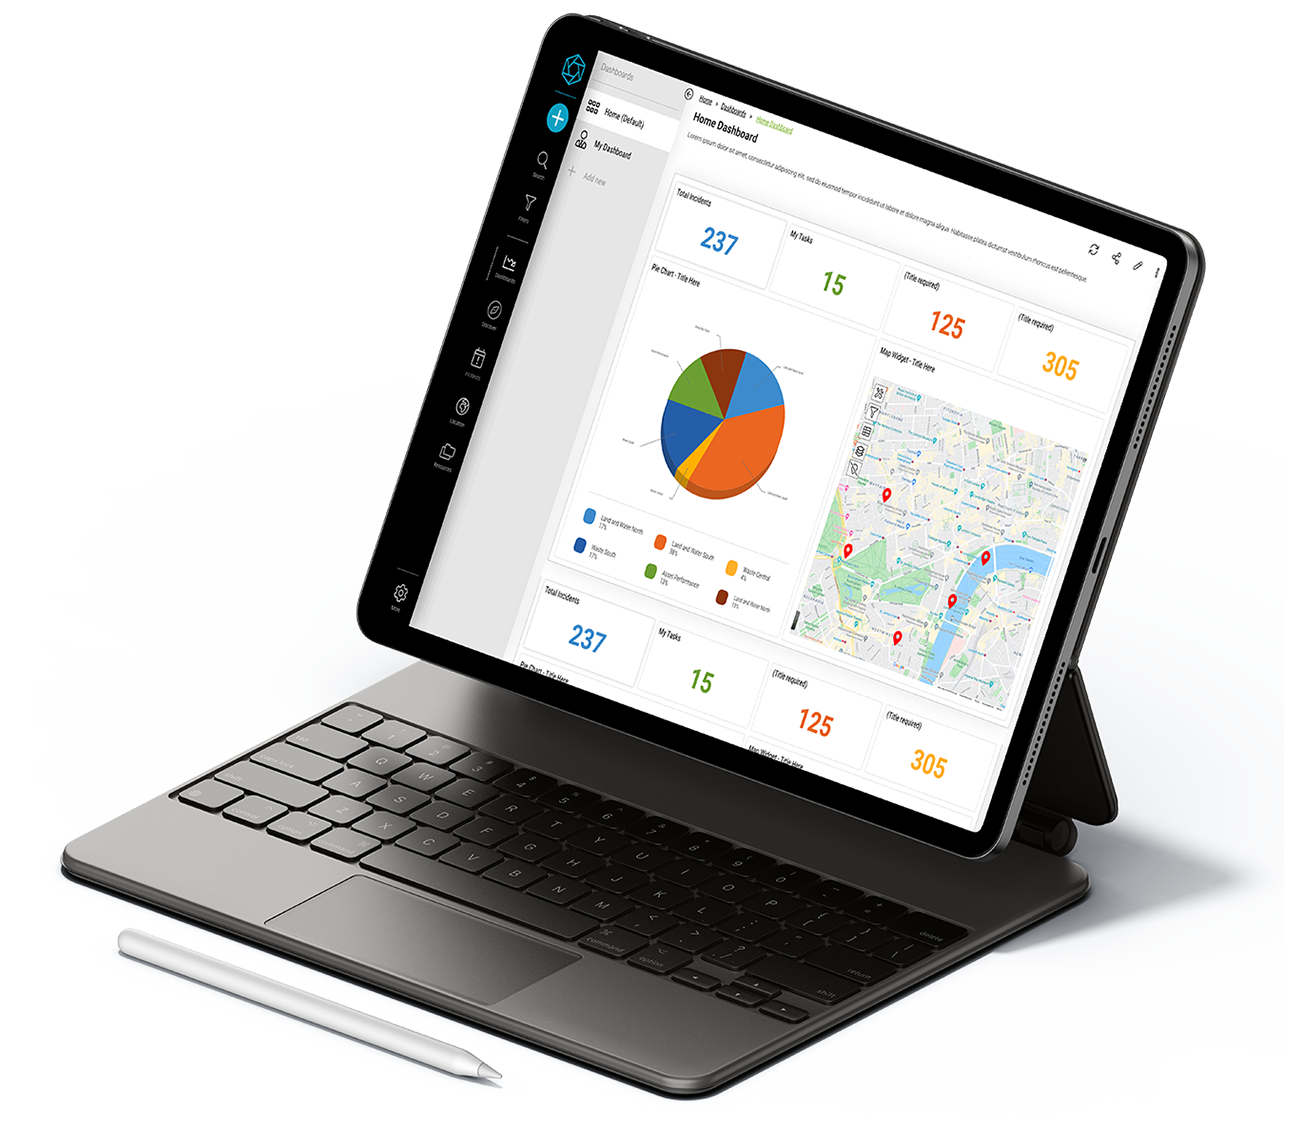
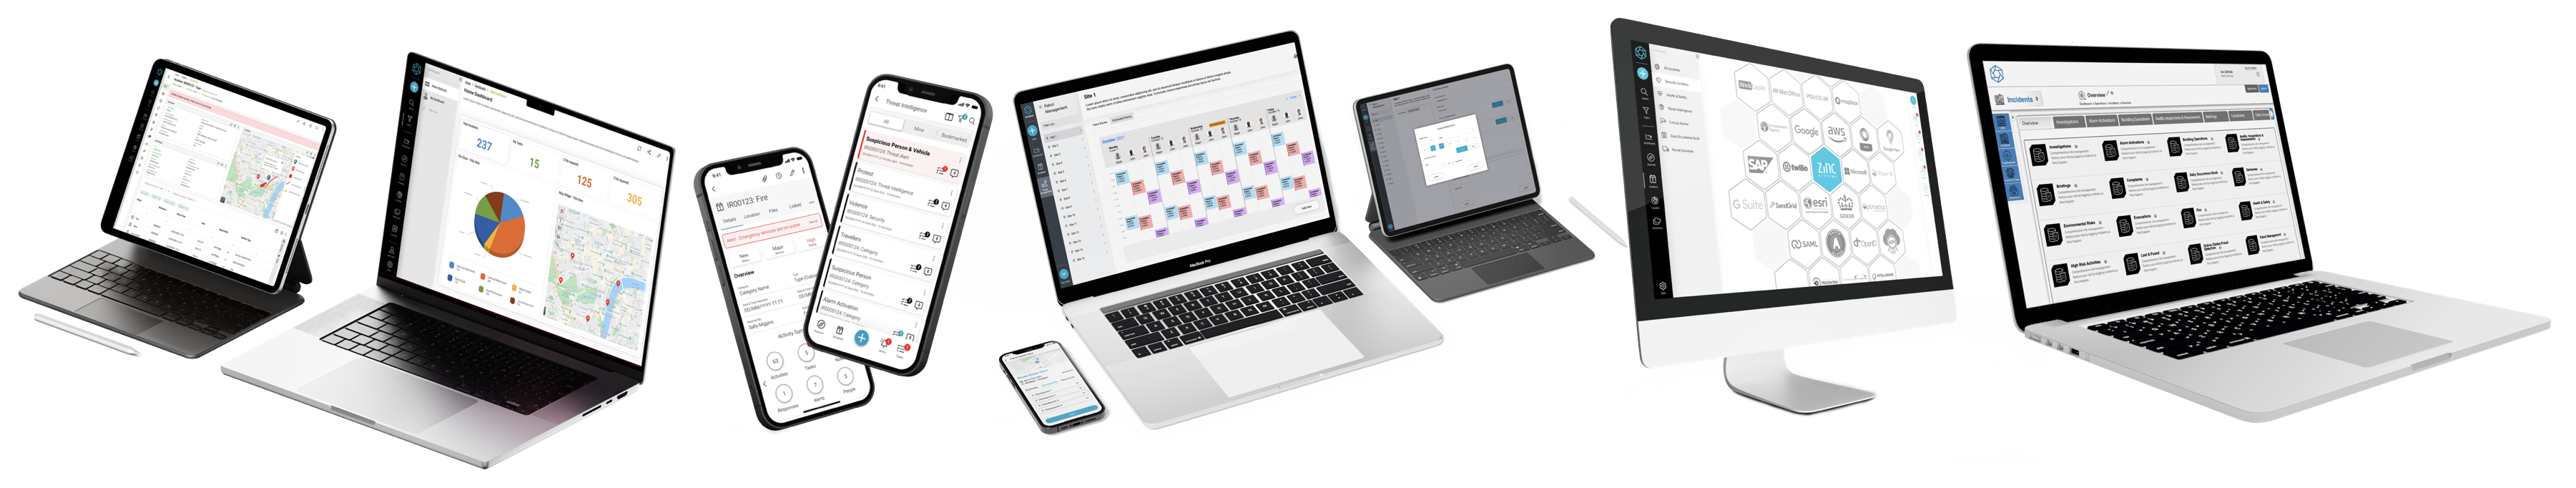
PRODUCT FEATURE GUIDE
Data analysis

Product Hero Image

Dynamic
dashboards

Dashboards significantly enhance the way organisations prepare for, respond to, recover, measure performance and ensure regulatory compliance. Dashboards not only optimises the handling of critical events and emergencies but also aligns with the strategic management of the overall operational risk picture.

This approach ensures that both global insights and local specifics are managed efficiently, enhancing the organisation’s resilience and protection of people, assets and profits.

Key benefits

  • Modern, flexible and beautiful dashboards – make business decisions with confidence.
  • Provides a comprehensive view of all critical events impacting the organisation globally and refine down to specific sites at a click of a button.
  • Provide comprehensive understanding of the status and implications of critical events, promoting timely and informed decision-making.
  • Interactive graphs and maps that display ongoing events, affected areas, and key metrics such as response time and resource allocation.
  • Role-based access levels to ensure that sensitive information is only accessible to authorised personnel to ensure compliance with internal and external data protection regulations.
  • Setup tailored dashboards for individuals, departments or locations, providing focused insights and management tools for local event handling and specific role-based analysis.
  • Operational day-to-day dashboards for tracking progress, task performance, event progression, hand-overs and managing resources efficiently.
Synapse Divider

DYNAMIC DASHBOARDS
Specification

Strategic
Enables long-term planning with a single-pane-of-glass and by visualising key metrics and trends to inform strategic decisions.

Operational
Facilitates daily management, optimising workflows and processes through real-time data and performance tracking.

Customisable
Instantly adapt to user needs, allowing personalised views, visualisations, metrics, and interfaces to enhance relevance.

Insightful
Provides deep insights through data analytics, helping to uncover patterns and opportunities for improvement.

Synapse Divider
Dashboard creation & basic setup

Create dashboards with a custom name, description and icon.

Within each dashboard, create internal tabs to provide further sections within the dashboard to display further analysis or information.

Edit and delete dashboards and tabs as and when required.

Set default dashboard as home page.

Drag and drop the order of dashboards and pages to organise appropriately.

Share dashboards with individual users and specific access levels or not sharing will keep it private to you.

Add widgets (see 'Widgets' below) to the dashboard and customise the size and position.

Export the dashboard as a PDF.

TV Mode to display on a TV or video wall.

Parent dashboard filter - refine the entire dashboard (tabs & widgets) to specific filters including by type, category, status, severity, priority, site and region.

Timeframe filter - available to instantly refine the dashboard down to a specific start and end date/time.

Widgets - Available

Count - Displays real-time numerical data count, simple, effective visualisation tool with click-through to view the data within.

List - Displays items in a traditional list format for easy data review with preview and click-through to view the data. See 'Data grids' for further details.

Grid - view in a visual gallery for data such as files (media) and involved parties (victims, witnesses, offenders) with preview and click-through to view the data.

Map - standard, satellite and 3D imagery (if available in the area) displaying the data on the map as heat-clusters or PINs with preview and click-through to view the data.

Text - adding of static text that can be used for adding custom text like summaries, links, references etc.

Charts - Visual representation of data, enhances understanding through graphs (pie, bar) and click-through to view the data within a chart segment.

Action buttons - Setup specific action buttons that act as quick links to add new records onto a page i.e. on a 'Security' dashboard you could add a number of quick link buttons to add various security incidents or 'Daily checks' dashboard you could have a button to instantly add a new check.

Widget - Setup

Add a widget anywhere on the dashboard

Select the widget type, enter a widget name, data source and if required a previously saved filter and size.

When the widget has been added, freely drag the widget around the screen and re-size to visualise the data just how you would like.

DYNAMIC DASHBOARDS
Frequently Asked Questions

Designing an effective dashboard layout involves several best practices to ensure that it is both functional and user-friendly. Implementing these best practices in dashboard design not only helps in presenting data in a more organised and meaningful way but also enhances the user's ability to analyse and act upon the information efficiently.Here are some key considerations for creating a dashboard that provides meaningful insights and enhances decision-making:

1. Understand User Needs

  • Identify the Audience: Tailor the dashboard to the specific needs, roles, and expertise of its users.
  • Define Objectives: Understand what users need from the dashboard—monitoring KPIs, operational oversight, strategic insights, etc.

2. Choose the Right Metrics

  • Relevance: Include only those metrics that directly support the dashboard’s objectives.
  • Balance: Provide a good mix of leading and lagging indicators.

3. Simplify the Design

  • Clarity: Use simple visual elements to ensure that the data is easy to understand at a glance.
  • Consistency: Use consistent design elements, colours, and fonts to avoid confusion.

4. Prioritise Information

  • Hierarchy: Place the most important data (e.g., critical KPIs) in the most prominent positions.
  • Grouping: Group related data visually to help users make associations and understand context.

5. Use Visualisations Wisely

  • Appropriate Chart Types: Choose graph and chart types that most effectively represent the specific kind of data being visualized.
  • Limit Colours: Use colour sparingly to highlight important information and guide the viewer’s eye.

6. Interactive Elements

  • Filters and Controls: Allow users to interact with the dashboard by filtering data, changing views, or drilling down into more detailed views.
  • Responsive Design: Ensure the dashboard is usable on various devices, adapting layout as needed.

7. Optimise Data Refresh Rates

  • Real-Time vs. Periodic Updates: Decide how often the data needs to be refreshed based on user needs and the nature of the data.

8. Provide Context

  • Data Annotations: Use notes and labels to explain unusual data points or trends.
  • Help Features: Include tooltips, help icons, or a FAQ section for less intuitive elements.

9. Test and Iterate

  • Feedback Loop: Regularly collect user feedback to refine and optimise the dashboard.
  • Usability Testing: Conduct tests to ensure the dashboard is intuitive and meets the users' needs.

10. Security and Access Controls

  • Data Security: Ensure that data displayed is secured and complies with relevant regulations.
  • Access Management: Control who has access to what data on the dashboard based on roles and needs.


Yes.

Setting up a single or a limited number of dashboards is best practice and is a very efficient approach. A single dashboard can serve multiple sites or user groups, with data visibility and access refined based on who logs in. This method leverages role-based access levels  and data security measures to ensure that each user sees only the data relevant and permissible to their role or location.

By following these steps below, you can create a highly effective and secure dashboard that provides a tailored user experience, displaying relevant data based on the user’s role and permissions, thus maximising efficiency and data security across multiple sites.

1. Centralised Dashboard Design

  • Unified Interface: Design a single dashboard interface that includes all possible data points and visualisations that might be relevant across different sites or departments.
  • Modular Layout: Create sections or modules within the dashboard that can dynamically adjust based on the data available for each user.
  • Segmentation: Organise data in a way that it can be easily segmented based on user roles or site locations.

2. Implement Role-Based Access Levels

  • Define Access Levels, Roles and Permissions: Clearly define roles within the organisation and assign specific data access permissions to each role. These roles could range from site-specific managers to regional supervisors.
  • Define the data: Configure the data types to be restricted to a user’s role. For example you might only want Health & Safety data to be viewed by the H&S and HR department and restricted to everyone else.

3. Testing, Validation & Maintenance

  • Usability Testing: Conduct thorough testing with users from different roles to ensure that they can only access appropriate data and that the dashboard meets their needs.
  • Security Testing: Regularly test for vulnerabilities in the authentication, authorisation, and data display processes.
  • Regular Audits: Periodically review and audit roles, permissions, and data access rules to ensure they still align with organisational policies and user needs.
  • Feedback Mechanism: Maintain a feedback mechanism to address any issues users face and to continuously improve dashboard functionality and security.


Yes.

Generic management information dashboard

There is a generic dashboard available which encompasses all data. During mobilisation we can work with you to setup what exactly you would like for your varying user needs and restrict down where required.

Generic operational dashboards

There are also generic operational dashboards available out-the-box. During mobilisation we can work with you to setup what exactly you would like for your varying user needs and restrict down where required.


  • Incident & critical event management
    • Daily occurrences
    • Emergency response
    • Incident management
    • Workplace health & safety
    • Alarm system activations
  • Compliance activities & patrol management
    • Task management
    • High risk activities
    • Risk register
    • Audits & checks
    • Proof of presence & security patrols

The concept of a "single-pane-of-glass" is a design and usability principle often applied in technology and business management to create a unified control interface. It's particularly relevant in contexts of running critical operations and providing a single view of 'everything that is important'.

Here's an overview of what a single pane of glass entails and its significance:

Definition and Purpose

Single Pane of Glass (SPOG) refers to a user interface that consolidates information from multiple sources into one comprehensive and accessible display. The aim is to eliminate the need for multiple monitors, systems, or screens, thereby simplifying the user experience and enhancing decision-making processes.

Key Features

  1. Centralised Monitoring and Control
    • Aggregation: Integrates data from various systems, applications, and networks into a central dashboard.
    • Control: Allows users to manage operations, execute tasks, and respond to events from a single interface.
  2. Data Visualisation
    • Interactive Displays: Uses charts, graphs, and maps to provide visibility into system performances, alerts, and statuses.
    • Customisation: Offers customisable views to cater to different user needs, focusing on specific metrics or operational areas as required.
  3. Enhanced User Experience
    • User-Friendly Interface: Designed to be intuitive and easy to navigate, reducing training time and promoting user engagement.
    • Accessibility: Accessible on various devices, including desktops, tablets, and smartphones, ensuring management capability from anywhere.

Benefits

  • Improved Efficiency: Reduces the complexity of monitoring and managing multiple systems, enabling quicker responses and more streamlined operations.
  • Enhanced Decision-Making: Provides a comprehensive overview of all relevant data, aiding in more informed and effective decision-making.
  • Reduced Costs: By centralising functions, it can lower the costs associated with maintaining multiple systems and platforms.
  • Scalability: Adapts easily to changes in the size and scope of an organisation's operations, supporting growth without the need for significant additional investments.

Overall Benefits:

In the context of critical event management, a single pane of glass could be instrumental in providing a holistic view of all ongoing incidents, resource statuses, and response activities. A single pane of glass is more than just a technical solution; it's a strategic tool that enhances the operational capabilities of an organisation, leading to more effective management and oversight of critical systems and events. It enables:

  • Quick Assessment: Rapid evaluation of incidents as they unfold.
  • Coordinated Response: Streamlined communication and coordination among different teams and departments.
  • Continuous Monitoring: Ongoing surveillance of recovery processes and impact assessment.


The term "unified data" in the context of critical event and compliance management refers to the practice of integrating and consolidating data from various sources into a single, coherent system. This unified approach facilitates easier access, analysis, and management of information, which is particularly important during critical events and for ensuring compliance with regulatory standards.

Unified data is a cornerstone of modern critical event management and compliance systems, empowering organisations to manage emergencies more effectively and maintain high standards of compliance. Here’s a detailed look at what unified data entails and why it’s crucial:

Definition and Purpose

Unified data means bringing together disparate data sets and streams into one comprehensive and accessible format. This involves the standardisation and synchronisation of data across different systems and platforms.

Key Characteristics

  1. Integration: Data from various sources (e.g., sensors, logs, operational systems, security feeds) is combined to form a holistic view.
  2. Standardisation: Different data formats are converted into a standardised form that can be easily accessed and used across the organisation.
  3. Real-Time Processing: Data is updated in real-time to ensure that the information is current, which is critical during fast-moving situations.

Benefits

  • Enhanced Decision-Making: Unified data provides a complete picture, enabling more accurate and timely decisions during emergencies.
  • Improved Compliance: Eases the process of monitoring, reporting, and ensuring adherence to laws and regulations because all relevant data is in one place and in a consistent format.
  • Increased Efficiency: Reduces the need for multiple checks and balances across disparate systems, streamlining processes.
  • Better Resource Management: Allows for more effective allocation and use of resources by providing comprehensive insights into available assets and their utilisation.

Applications in Critical Event and Compliance Management

  1. Critical Event Management: During an emergency, having unified data allows for a quick, informed, and coordinated response. Decision-makers can access everything from real-time security footage to communication logs in one interface, enabling them to react swiftly and effectively.
  2. Compliance Management: Unified data helps ensure that all regulatory requirements are met by providing a clear and auditable trail of data management practices and decisions. It simplifies the process of gathering and presenting information to regulatory bodies or auditors.


Yes, exporting data into a third-party Business Intelligence (BI) tool (like Microsoft PowerBI, Google Looker, Tableau etc.) is a common practice. This process allows you to take advantage of advanced analytics and the overlay of other internal data sets not in our platform.

Contact us to access our Marketplace.

Zinc Synapse Suite

QUICK CONTACT